Regression
We shall be looking at regression solely as a descriptive statistic: what is the
line which lies 'closest' to a given set of points. 'Closest' shall be defined
as minimizing the sum of the squared y (vertical) distance of the points
from the regression line (which is more fully called the least squares regression line). We shall not derive the formula, merely present it
and then use it. Data is given as a set of points in the plane, i.e., as
ordered pairs of x and y values.
Formulæ
- x-bar = *sum*x(i)/n
This is just the mean of the x values.
- y-bar = *sum*y(i)/n
This is just the mean of the y values.
- SS_xx = *sum*(x(i)-(x-bar))^2
This is sometimes written as SS_x (_ denotes a subscript following).
- SS_yy = *sum*(y(i)-(y-bar))^2
This is sometimes written as SS_y.
- SS_xy = *sum*(x(i)-(x-bar))(y(i)-(y-bar))
- b_1 = (SS_xy)/(SS_xx) (_ denotes a subscript following)
- b_0 = (y-bar) - (b_1) × (x-bar)
- The least squares regression lilne is:
y-hat (lowercase y with a caret circumflex) = (b_0) + (b_1) × x
Example
What is the least squares regression line for the data set {(1,1), (2,3),
(4,6), (5,6)}?
- x-bar = (1+2+4+5)/4 = 3
- y-bar = (1+3+6+6)/4 = 4
- SS_xx = ((1-3)^2+(2-3)^2+(4-3)^2+(5-3)^2) = 10
- SS_yy = ((1-4)^2+(3-4)^2+(6-4)^2+(6-4)^2) = 18
- SS_xy = ((1-3)(1-4)+(2-3)(3-4)+(4-3)(6-4)+(5-3)(6-4)) = 13
- b_1 = 13/10 = 1.3
- b_0 = 4-1.3 × 3 = .1
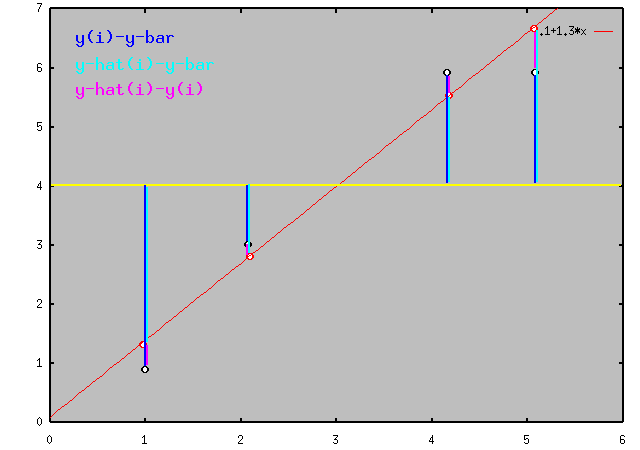
- y-hat = .1 + 1.3x
The points on the regression line corresponding to the original x values are:
y-hat(1)=1.4, y-hat(2)=2.7, y-hat(4)=5.3, y-hat(5)=6.6. The regression line
can also be used to provide the best estimate for the y value associated with
an x value which is not given: y-hat(3)=4.
The least squares regression line is displayed in the following figure:

Applets: An applet drawing regression lines through scatter plots has been drawn by David M. Lane.
Competencies: For the paired data set {(2,3), (3,5), (4,2), (3,6), (5,8)},
What are the mean, variance, and standard deviation of the x values?
What are the mean, variance, and standard deviation of the y values?
What is the least squares regression line for y as a function of x?
What is y-hat (3) ? y-hat (6) ?
Reflection: How is the equation for y as a function of x related to the equation for x as a function of y?
return to index
Questions?
