Correlation
Correlation
The least squares regression line is the 'best' line
for a set of points, but there will always be a least squares regression line;
whether the line is 'close' to the points is another question. One way this is
measured is with the correlation coefficient:
r = (SS_xy)/((SS_xx)(SS_yy))^.5
where the quantities on the right hand side were defined
previously. For the previous example,
r=13/(10 × 18)^.5 = .969.
Note that r will always be betwwen -1 and 1 (inclusive). When r=1, all the
points lie on a line with positive slope; when r=-1 all the points lie on a
line with negative slope; when r=0, the points are not easily identified with
the line.
Coefficient of determination
Another measure of the closeness of the points to the regression line is the
coefficient of determination.
r^2 = (SS_(y-hat)(y-hat))/SS_yy
which is the amount of the squared deviation which is explained by the points
on the least squares regression line.

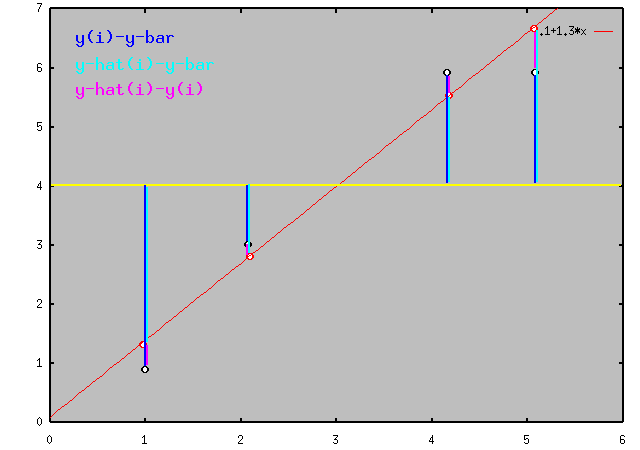
In the figure, it is the sum of the squares of the lengths of the cyan segments
divided by the sum of the squares of the blue segments.
For the previous example,
SS_(y-hat)(y-hat) = (1.4-4)^2+(2.7-4)^2+(5.3-4)^2+(6.6-4)^2 = 16.9, so
r^2 = 16.9/18 = .9389 (which is equal to .969^2). The magenta segments (y(i) -
(y-hat(i))) are called the residuals or errors; *sum*(y(i)-(y-hat(i)))^2 = SSE.
SS_yy = SS_(y-hat)(y-hat) + SSE (the total squared deviation can be
partitioned into
that which is explained by the regression line, and the error).
r^2 is between 0 and 1, inclusive.
Remarks
- r^2 = r^2 (the square of the correlation coefficient is the coefficient
of determination).
- r and b_1 have the same numerator, and positive denominators, hence r and
b_1 are both positive or negative as SS_xy is.
- SS_xx/(n-1) is the variance of the x
coordinates (and similarly for SS_yy).
- b_1 and r differ by a factor of the ratio of the standard deviations of
the x any y coordinates. Hence the slope of the least squares regression line
is the correlation modified by the relative spread in the x versus y
direction.
- y-bar = (y-hat)-bar (the average of the y values is equal to the average
of the corresponding y values on the least squares regression line; i.e., the
average
of the y values of the black circles is equal to the average of the y values of
the red circles in the figure above).
Applets: The relation between correlation and the scatterplot of data is illustrated by Gary McClelland (I think the x and y spreads are equal). A game of guessing correlations from scatter plots has been built at University of Illinois (Champaign-Urbana).
Competencies: For the paired data set {(2,3), (3,5), (4,2), (3,6), (5,8)},
What are the coefficient of correlation and coefficient of determination?
Reflection: How is the correlation coefficient for y as a function of x related to the correlation coefficient for x as a function of y?
return to index
Questions?
