In the old days... Printed maps... Number of colors affected total cost. Now, on-line... But colors still matter: usability.
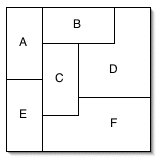
Consider this map of a very square continent:
Your tasks:
You may, of course, do the steps in any order you like.
Here is my coloring for the map:

Question: What is the minimum number of colors needed to color this map?
Four. We can economize early in the labeling in order to save colors. After coloring A blue and C green, I colored both B and E red. Alas, D and F need different colors -- they both touch a red state and a green state, but also each other!It has been proven that four is enough colors for all planar maps.
My graph representing the map looks like this:
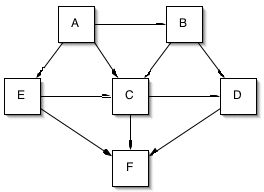
In this graph, each node corresponds to a state on the map. There is an edge between two nodes if the corresponding states touch one another. Whenever you create a graph to model a problem, be sure you understand what each node and edge means.
This graph captures exactly the same "neighbor" relationships found in the map. So, four colors is all we need to color the graph, too. In general, though, four is not enough colors for all graphs, because a graph can have a higher connectivity than regions in a plane.
Finally, here is an algorithm for coloring a graph:
Notice...
Question: Is there any advantage to choosing the vertices in a particular order?
As written, this algorithm is nondeterministic. It does not specify the order in which we are to select nodes to be colored. As a result, it could have different behaviors for different executions.For this graph, there is no advantage to choosing the vertices in a particular order. It requires four colors, no matter how we color them.
Can you design a graph where choosing the wrong vertex first matters?
Sometimes, processing vertices with higher degree first can help. The degree of a vertex is the number of edges entering or exiting the vertex. In the map above, vertex C has a degree of 5, and the remaining vertices have a degree of 3.
Question: What is the time complexity of the algorithm above?
- Let D = maximum degree d(v) of any vertex v.
- It makes n = |V| passes through the loop.
- It makes d(v) passes on the Step 2 inner loop.
- So, O( nD ). Assuming no "loops", or edges of the form (x,x), the worst case for D is n-1, which gives a complexity of O( n(n-1) ) → O( n² ).
Graph coloring is one of the classic graph problems. (Which kind of problem is it?) It has important applications in scheduling and other resource allocation problems.
The primary goal of algorithm analysis is to describe how much of a resource the algorithm uses. Different resources are important in different problem domains, but generally we will concern ourselves with the most broadly important: time and space. Time is the quintessential limiting resource. Space also limits many algorithms in fundamental ways, though as technology develops the scale of space's limitations changes.
The act of analyzing an algorithm requires that we find a way to measure the use of the resource in a general way. We then cast this measurement in terms of how much resource usage grows as the size of the problem instance grows. For example,
O, pronounced Big Oh, expresses an upper bound. It is a function that bounds the growth of the resources used from above. We ignore constants and lower-order terms because, as n grows, the highest-order power "dominates".
Ω, or Omega, expresses a lower bound. It is a function that bounds the growth of the resources used from below.
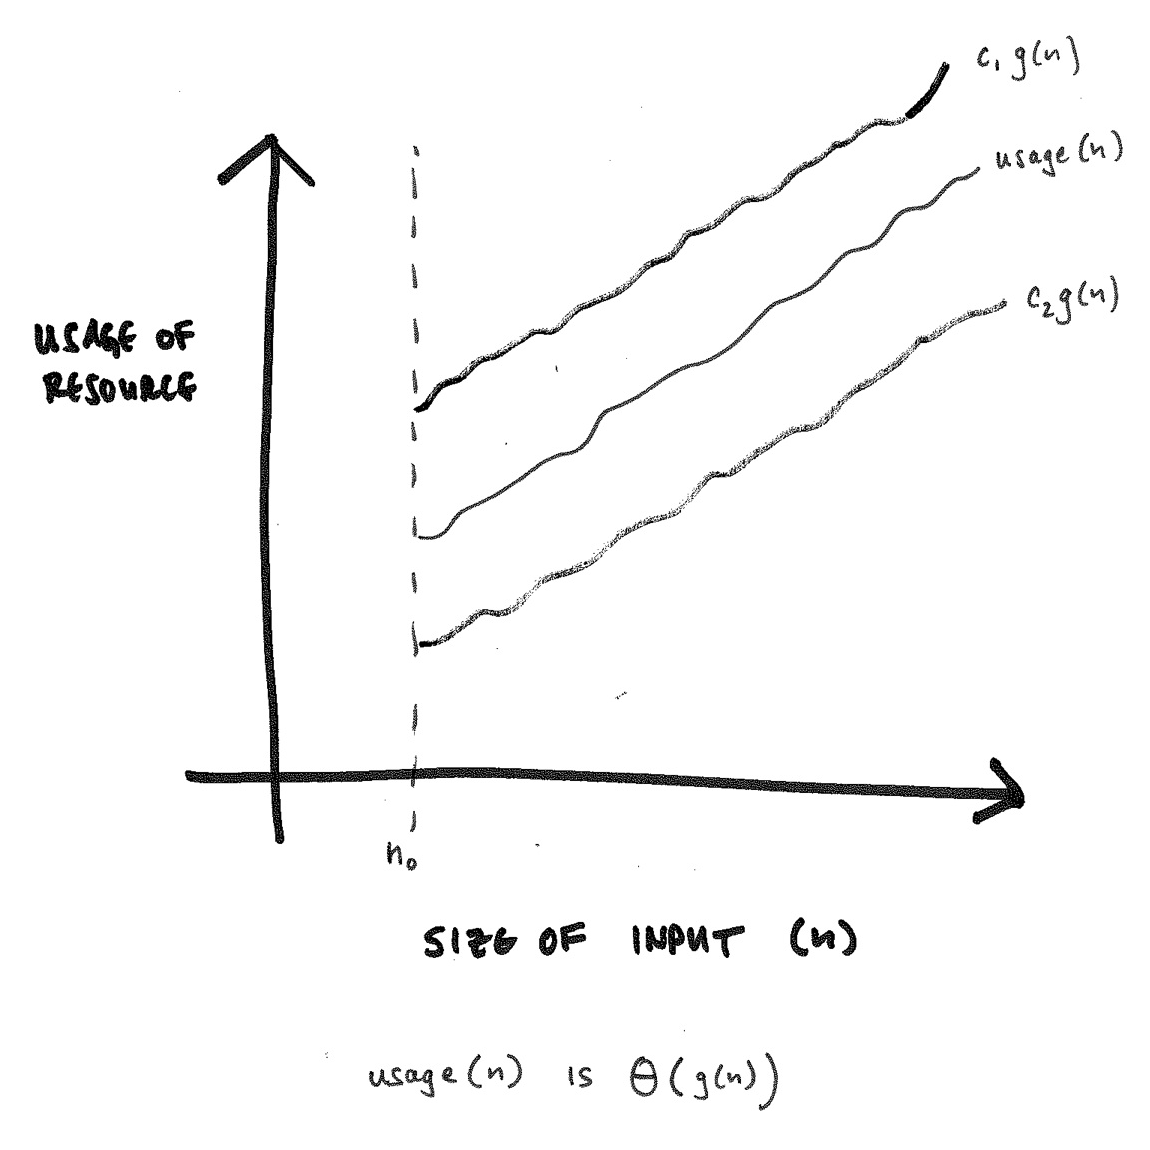
Θ, or Theta, is a function that combines Big Oh and Omega. It bounds resource usage of the algorithm from above and below using the same function, though perhaps with different constants.
Questions: Why would we want to know Big Oh? Ω? Θ?
Question: How do we show that 4n² + 6n - 4 is Θ(n²)?
    10n² ≥ (4n² + 6n + 4) for all n ≥ 2

    (4n² + 6n + 4) ≥ 4n² for all n ≥ 0
The 2 and 0 at the ends of these statements are the n0 you see in textbook definitions. They show that, once the size of the problem gets big enough, the algorithm's fundamental performance characteristics determine the consumption of the resource more than any external factors.
Question: Why do we care about the values of n0 on these definitions?
Can you think of an example? (Files in a directory. Names on a class list.)
Know your problem domains. Know your implementations.
You own five pairs of socks, one per day. You do your laundry on the weekend to get ready for the next week. One weekend at the laundromat, you lose two socks.
Your job:
There are 10[C]2 = 45 possible outcomes choosing 2 socks from 10. There are only five outcomes that are best-case, which gives a probability of 1/9. The only other possibility is the worst case, with a probability of 8/9. So the "expected value" of the number of complete pairs is (1/9)*4 + (8/9)*3 = 3 1/9.
Wow. Discrete Structures matters. Probability and other math help, too.
Some algorithms perform differently than you might expect under certain circumstances. Knowing these about an algorithm can make a big difference in performance.
Understand the algorithms you study.
Find the basic operation: the one that is performed most often, or the one that dominates the algorithm's resource usage for some other reason, such as the underlying implementation. (Example: RAM versus file system.)
Often, this is straightforward. Consider this simple sequential search algorithm:
    search(list L, item T)

    1.  for i = 1 to n
        a.  if L[i] == T return i
    2.  fail
The basic operation here is the comparison L[i] == T. It determines whether the algorithm stops or not. This algorithm could run 0 times or n = |L| times, depending on the presence and position of T.
Some common basic operations when analyzing algorithms are:
Some sorting algorithms have differently shaped complexity curves for comparisons and swaps, so they are best compared using both metrics.
Know your problem domain.

|
Recall the graph challenge above: Can we design a graph where choosing to color the wrong vertex first gives a less than optimal result?
A bad case for this algorithm is a bipartite graph -- a graph in which the vertices can be partitioned into two subsets where all edges are between the subsets. A greedy coloring of a bipartite graph can give especially bad behavior. The best way to color the graph is to give the same color to all vertices in each subset, resulting in using only two colors. My algorithm can give such a coloring if it selects the vertices in the right order. If it selects them in the wrong order, it can use |V|/2 colors!