Paired Programming Activity
File I/O
These problems will be completed using an editor such as Thonny or IDLE and submitted to Autolab for grading.
Introduction
I bet that at least some of you play Fantasty Football or follow your favorite team. Have you ever gotten in to an argument about who is the better quarterback - Brock Purdy or Patrick Mahomes? [Of course, not. We all know it is Brock. Go Cyclones!] Well, one of the ways we could answer this question without just personal opinion is through the use of the Quarterback Passer Rating.
The QB Passer Rating is a standard statistic in football that can be used to compare two QBs. To calculate the passer rating you need five pieces of information:
- the number of passes attempted
- the number of passes completed
- total passing yards
- the number of touchdowns thrown
- the number of interceptions thrown
To calculate the passing rating used in the NFL you:
- Calculate four sub stats:
- Completion portion (A)
- You calculate "completions per attempt" and then multiply by 100, subtract 30, then divide the whole thing by 20
- Yards portion (B)
- You calculate "yards per attempt", subtract 3, all divided by 4
- Touchdown portion (C)
- You calculate "touchdowns per attempt" times 20
- Interceptions portion (D)
- You calculate "interceptions per attempt" multiply this by 25 and then SUBTRACT FROM 2.375
- That is, 2.375 - (IPA*25)
- Completion portion (A)
- Adjust each of the sub stats:
- If any of the sub stats (A, B, C, or D) is above 2.375 you should set those stats to equal 2.375
- If any of the sub stats is below 0 you should set those stats to equal 0
- Hint, this can be much easier if you write a separate helper method just to clean a single stat to be between 0 and 2.375
- create a function called dataClean() that takes in a number and then
- if it is less than 0, return 0
- if it is more than 2.375, return 2.375
- otherwise, return the actual number left alone
- create a function called dataClean() that takes in a number and then
- Calculate the passing rating by taking the sum of all four adjusted values, dividing by 6, then multiplying by 100
This final result is their passer rating.
[Note, that can be a little bit confusing to read in text. You can look up "Passer Rating" on wikipedia. They structure their formulas a bit differently but it is the same result.]
FINALLY, in general you can use this number to predict how good of a year the QB is having (or had).
| Score | Rating |
|---|---|
| 85 or lower | Bad |
| Above 85 but 90 or lower | Mediocre |
| Above 90 but 95 or lower | Good |
| Above 95 | Great |
In this activity we are going to consider what kind of years the various quarterbacks in the NFL had during the 2022 season.
Program Guide
For this assignment you should create the following functions in the main.py file for this project on Replit
In this assignment you will make three functions. The first two are smaller, helper functions that will be used by the third function.
Part 1: Create a function called: passerRating()
This function should:
- Parameters - the five parameters listed prevously IN THIS ORDER
- the number of passes attempted
- the number of passes completed
- total passing yards
- the number of touchdowns thrown
- the number of interceptions thrown
- Actions:
- Using the formula listed above calculate the passer rating
- Returns:
- The passer rating as a floating point number rounded to two decimal places
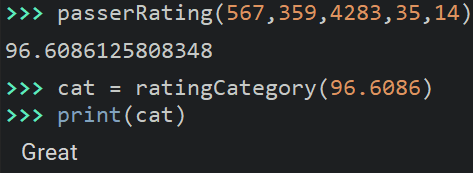
- Example Run
- Josh Allen's stats for 2022 were:
- Josh Allen's stats for 2022 were:
This function will be assessed by
Part 2: Create a function called: ratingCategory()
This function should:
- Parameters -
- a single QB passer rating
- Actions:
- Using the categories listed above caculates and returnsthe string containing the kind of year they are having.
- Returns:
- The String of the kind of year they are having
- Example Run
- Josh Allen's stats for 2022 were:
- Josh Allen's stats for 2022 were:
This function will be assessed by
Part 3: Create a function called: addColumns()
This function should:
- Take two parameters:
- input file name
- output file name
- Returns:
- Nothing
- Actions:
- Opens the input file
- Opens the output file
- Pulls off the header and adds two more columns labeled "PasserRating" and "Classification"
- For each player provided in the data file you opened:
- extract the appropriate columns
- use the two helper functions you just created to calculate passer rating and classification
- writes the original data PLUS the passer rating and the classification to the output file
- Closes both files
- Example Output
This function will be assessed by


