Paired Programming Activity
File Problems
These problems will be completed using an editor such as Thonny or IDLE and submitted to Autolab for grading.
Background
A couple of years ago I was reading an article in my local newspaper [yes, I was still reading the local newspaper] that mentioned that the Waterloo school district had had it's best 4 year graduation rate in history. The number quoted seemed low to me - even for an urban school - so I got curious about the average graduation rate for schools in Iowa. That led me to find this data file for the 2017 school year.
- graduation_dropout.csv
- small_sample.csv [I will often make a small file available so that you can hand test your own code]
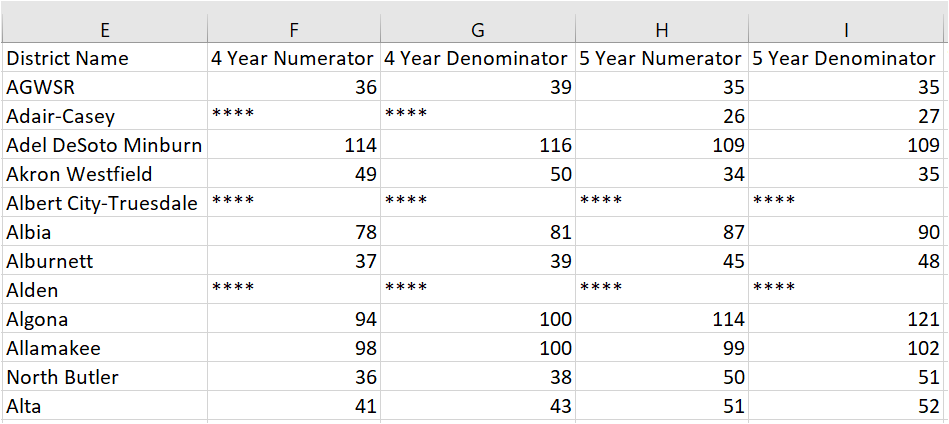
Let's just look at this data for a second:

I have snipped in to only look at some of the data. But let's focus in on the row for AGWSR. The data shows that by the spring of 2017 36 of the 39 students who started as freshman in fall of 2013 had graduated in the four year period. Similarly, it shows that all 35 of the 35 students who started as freshman in fall of 2012 had graduated within that five year period.
Some schools have not reported some data. For example, Adair-Casey had reported their 5 year data but not their 4 year data. Alden had not reported any data. Every field with missing data is marked with the symbol "****"
Program Guide
Part 1: Create a function called fourYearAverage() that:
- Takes in one parameter - a string containing the name of the file to be used
- Note, the file used should be in the same folder as your code
- Opens the file provided by the parameter
- Extracts the information for each school in the file
- If the school reports four year graduation data, stores this information as needed in order to...
- ...calculate the average graduation rate for all students from the schools with valid data
- You will need to watch for the **** which indicates a school didn't send in data
- RETURNS:
- The floating point percentage of students who graduated in four years.
- Return this in the format shown below.
- For example, you can see in the small_sample file that 314 of 325 students graduated in four years.
- Example:
This function will be assessed by
Part B: Create a function called addColumns() that:
- Takes in two parameters
- a string containing the name of the file to be used for reading
- Note, the file used should be in the same folder a your code
- a string containing the name of the file to be used for writing
- Note, this can be a completely new name
- a string containing the name of the file to be used for reading
- Opens the files provided by the parameters as appropriate
- Extracts the information for each school in the file
- On a SCHOOL BY SCHOOL basis this code should add two columns at the end of the row for that school
- 4 year graduation rate for that school
- 5 year graduation rate for that school
- If there is no data for that statistic you should include "****" in that column
- Save this new data file
- For example, we noticed earlier that AGWSR had a 4 year graduation rate of 92.3 and a 5 year graduation rate of 100
- returns nothing
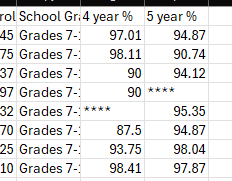
- A sample run of your program will look like this. Notice this doesn't really look like much. The function doesn't actually return anything but it DOES do stuff "behind the scenes."
- But when we open the newly created csv file we see that it added columns cleanly (double check this with your results).
- Since the autograders are a little picky when it comes to grading, please note the following:
- The titles in your two new columns should match mine exactly including spaces between the number/word and word/%
- 4 year %
- 5 year %
- You should round the results to two decimal places as shown above. Remember that Python's round will not add places if they don't exist such as with the 90s in the example above.
- The titles in your two new columns should match mine exactly including spaces between the number/word and word/%
This function will be assessed by


