Cumulative data distributions
Sometimes one is more interested in questions such as how many people make less
than $20,000, how many make less than $50,000, how many make less than $100,000, etc., rather than how many make between $20,000 and $40,000.
Such information is recorded as a cumulative distribution.
For the
weights of students there were 3 students between 87.5
and 112.5 pound, 7 between 112.5 and 137.5 pounds, 8 between 137.5 an 162.5
pounds, etc.; this is the information which was displayed in the histogram. The cumulative distribution would record
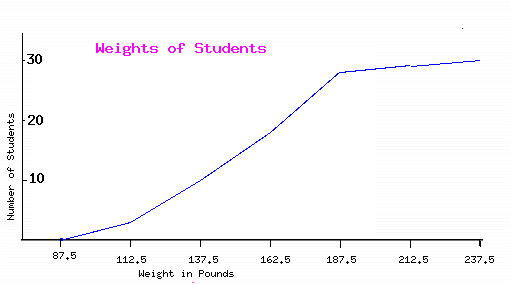
that 3 people weighed less than 112.5 pounds, 10 people weighed less than 137.5
pounds, 18 people weighed less than 162.5 pounds, etc. This cumulative
frequency distribution can be displayed graphically in an ogive (the Concise
Oxford Dictionary defines ogive as a diagonal groin or rib of a vault; a
pointed or Gothic arch; this shape is manifest in the graph below?). A
cumulative frequency ogive for the weights of students is displayed below.

Note that the class boundaries rather than class marks are labelled, the
cumulative number of individuals is read off the graph at the right boundary
of the class, and straight (diagonal) lines are drawn accross each class.
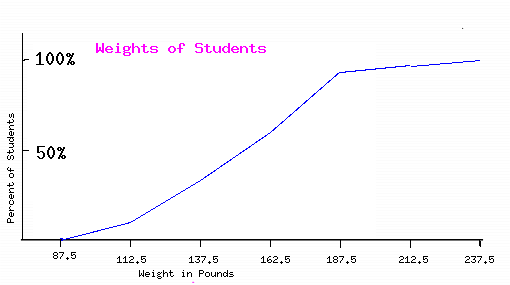
The information can also be displayed in a cumulative relative frequency
ogive as indicated below.

return to index
Questions?

